How ArcGIS Insights works

1. Bring in your data
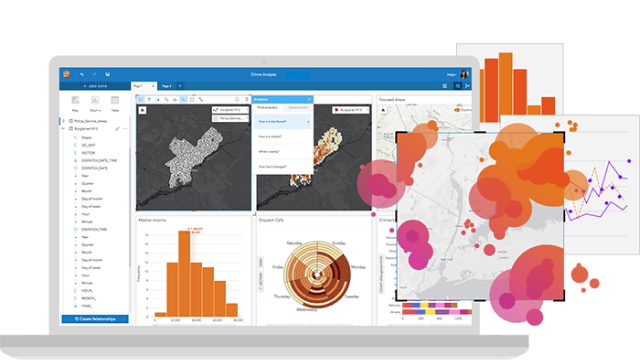
Connect to your SAP HANA databases to drag and drop your data directly onto a page. Visualize data on cards as maps, charts, and tables.
2. Find answers
Insights uses advanced tools to organize your analytical activity based on questions involving mapping, spatial analysis, and other visualizations.
3. Show your work
Clearly communicate how you arrived at your conclusion. Share a step-by-step model of your analysis or workbook results, internally or externally.

ArcGIS Insights
+ SAP HANA
Data Analytics Powered by Location