Real-Time Visualization and Analytics
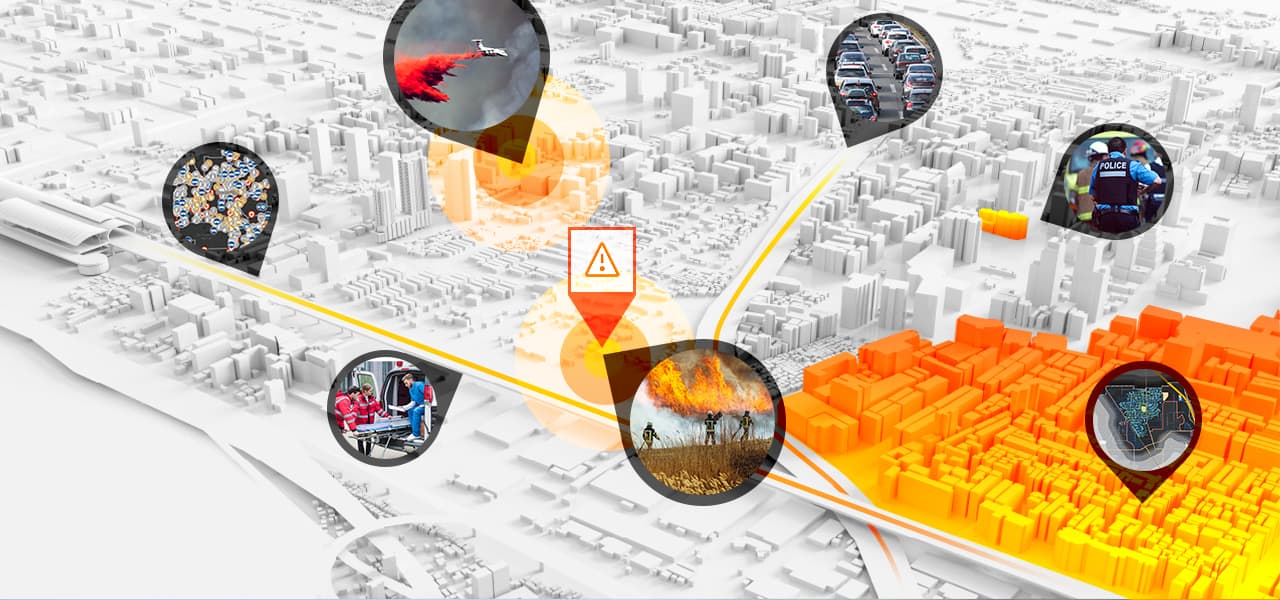
Gain visibility to distributed work to address issues as they arise and keep track of all response operations. Aggregate damage reports quickly to put limited resources to best use.

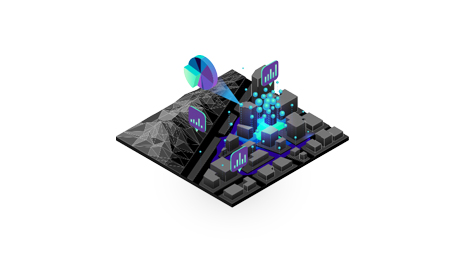
Respond with confidence
Know where and how to best respond by using insights from location intelligence
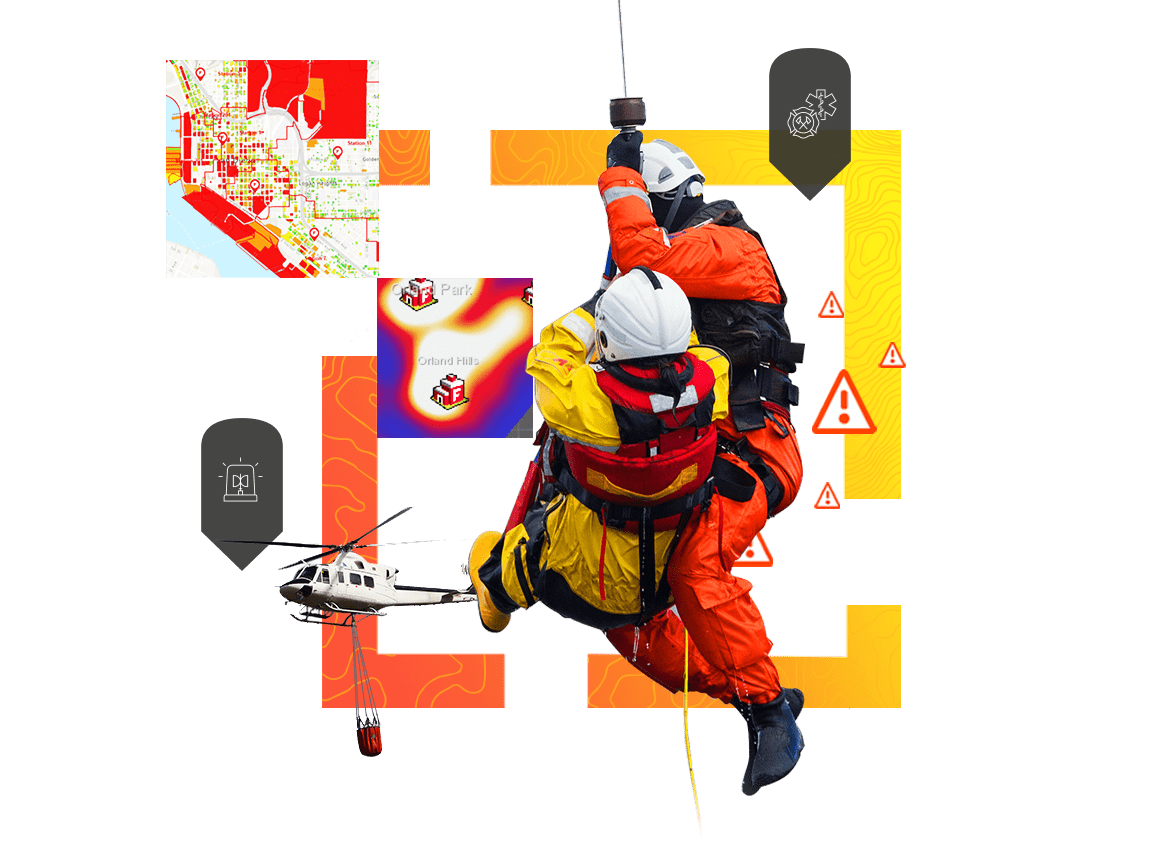
During an incident, implementing a suite of real-time tools for operations centers and field personnel keeps everyone aligned on the mission and helps restore order to the chaos.
Combine information for agile decision-making in a crisis using location intelligence technology from the Esri Geospatial Cloud.
Gain visibility to distributed work to address issues as they arise and keep track of all response operations. Aggregate damage reports quickly to put limited resources to best use.
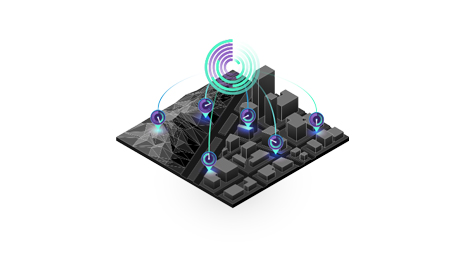
Deploy personnel and sensors to gather data and report on damages from the moment an incident occurs. Connect fieldworkers with their peers to coordinate actions without the need for trips to a control center.
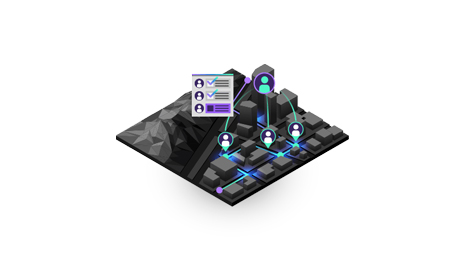
Visualize where people, places, and resources are to gain a clear understanding of risk. See what's happening across the organization, create robust safety plans, and know where to allocate resources.
Begin a conversation online.
Talk over the phone.